Congo Basin forest biomass and disturbance in Python and xarray
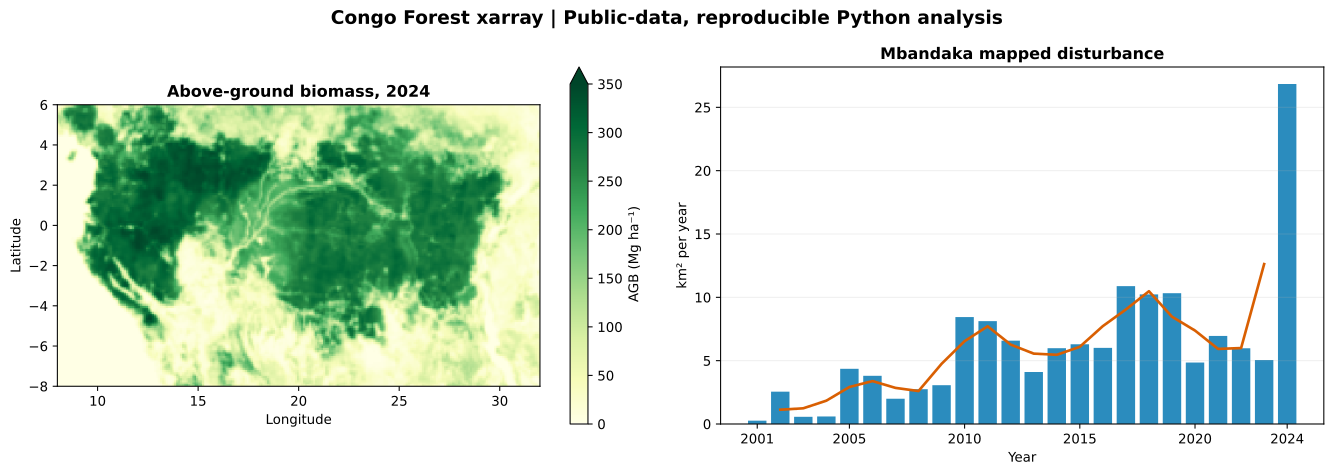
A tested, reproducible Python workflow reads ESA CCI Biomass v7.0 and Hansen/UMD Global Forest Change v1.12 from public services and finds 146 km² of mapped stand-replacement disturbance near Mbandaka, DRC, between 2001 and 2024.
November 2026 · Congo Basin regional window (8–32°E, 8°S–6°N) and Mbandaka window, Democratic Republic of the Congo · Code: github.com/kisife/congo-forest-xarray
What the code does
The workflow pulls only the spatial subsets it needs, with no account or paid service. Biomass and its per-pixel standard deviation come from the CEDA NetCDF Subset Service. Loss-year and data-mask layers come from public Hansen/UMD GeoTIFF tiles, read as windows with rasterio. Both become labelled xarray datasets, and every area is computed from latitude-aware spherical pixel areas rather than a flat-grid assumption.
The package has offline unit tests for pixel area, water masking, annual accounting and biomass summaries, a continuous-integration workflow, two executed notebooks and a single script that regenerates every figure and table.
Results
| Indicator | Result |
|---|---|
| Area-weighted mean above-ground biomass, 2024 | 146.1 Mg ha⁻¹ |
| Mapped woody biomass stock in the window, 2024 | 60.6 Pg |
| Area with biomass ≥ 200 Mg ha⁻¹, 2024 | 39.0% |
| Median relative per-pixel uncertainty, 2024 | 18.2% |
| Cumulative mapped disturbance, Mbandaka window, 2001–2024 | 146.6 km² |
| Largest annual value | 26.8 km² in 2024 |
The 2024 value is more than five times the 2023 value of 5.1 km². It is reported as a map summary, not as evidence of a real-world surge: it needs checking against imagery and field data before any causal reading.
Limits
The biomass frame is a rectangle, not the Congo Basin watershed, and ESA biomass is not masked to a forest definition, so the stock includes woody biomass outside forest. Year-to-year biomass differences are not emissions or removals. Hansen loss records first stand-replacement disturbance only; it misses most selective logging and degradation, does not record regrowth and does not assign a cause. Annual figures are pixel counts, not design-based area estimates with confidence intervals.
Reproduce it
Clone the repository, install the requirements and run python scripts/reproduce.py. The script downloads the regional subsets, caches them and rebuilds every output.
Data: Santoro, M. and Cartus, O. (2026), ESA Biomass Climate Change Initiative (Biomass_cci) v7.0, NERC EDS Centre for Environmental Data Analysis, doi:10.5285/6429d1aafe1e43b9b414e4a5a7f8b903. Hansen, M. C. et al. (2013), High-resolution global maps of 21st-century forest cover change, Science 342: 850–853; Global Forest Change v1.12, CC BY 4.0. Analysis in Python with xarray, rasterio and matplotlib.